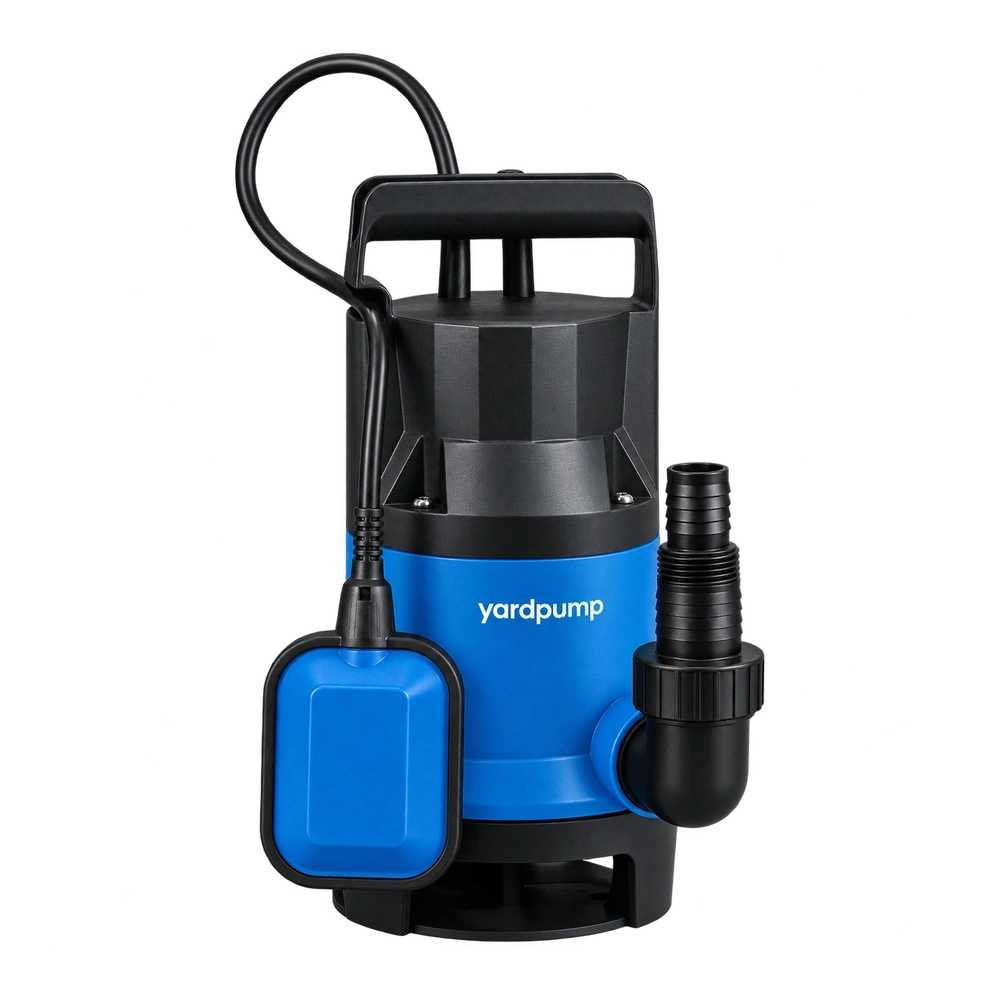
The same pump on the same test bench gives a different flow when another operator takes over. Is the pump unstable, or did someone measure incorrectly? Separate sample changes, repeated-measurement scatter, fixtures and operator effects before choosing an explanation. A repeatability and reproducibility study evaluates whether the measurement process supports the decision. It is not an employee-ranking exercise.
“Same conditions” need a definition
Valve position, water level, temperature, voltage, air removal, hose layout and stabilisation can change between runs. If a new operator also changes the fixture, the apparent operator effect includes a fixture change. A pump warming up, running in or intermittently ingesting air can also change successive results without an instrument defect.
Define whether the quantity is flow at a fixed total head or flow at an unchanged valve position. These are different measurements. One person adjusting the valve to a pressure and another aligning a handwheel mark may enter numbers under the same table heading while testing different operating points.
Ask two different questions
Repeatability examines scatter when the same operator and system repeat measurements under reasonably consistent conditions. Reproducibility examines differences associated with changes such as operator. Define what is allowed to change in the study. Otherwise environmental variation may be assigned incorrectly to a person's name.
The study does not independently establish absolute accuracy. Everyone can agree closely while sharing a flowmeter bias or an incorrect pressure boundary. Calibration, bias, stability and resolution remain separate considerations. Good repeatability is one part of measurement capability, not a substitute for the whole measurement chain.
| Observed pattern | Initial investigation |
|---|---|
| Large scatter for one operator | Stability, fixture, reading method and instrument behaviour |
| Different operator averages | Method interpretation, settings and boundaries |
| Common high result | Shared bias, units or measurement definition |
| A progressive time trend | Temperature, sample state or drift |
Design the study to separate effects
Select samples covering relevant range or product variation. Have several people familiar with the process measure them repeatedly in an established sequence, retaining individual values. Sample and repetition counts should suit the purpose, risk and method. A familiar numerical recipe is not a mandatory programme for every pump test. Where practicable, prevent earlier readings from influencing later ones.
A changing test object cannot automatically be treated as a stable part measured repeatedly. A pump's evolving thermal condition is one example. Establish the required stabilisation or choose a study capable of separating time effects. Software can calculate a percentage even when the experiment does not support its interpretation.
Interpret scatter against the decision
Suppose three hypothetical readings at a target point are 6.0, 6.1 and 5.9 cubic metres per hour. They describe those observations, but their range alone does not prove the method adequate. A narrow contractual tolerance may make the variation important; a preliminary screening decision may have a different requirement. These numbers are illustrative, not product measurements.
When comparing measurement variation with product variation or tolerances, state the statistical definition used. Retain study conditions, calculations and acceptance rationale, not merely a screenshot of a green pass indicator. Decisions close to an acceptance boundary also need an agreed decision rule and appropriate consideration of uncertainty.
Improve the process, then verify it
Operator-related differences may lead to clearer valve-setting, air-removal, stabilisation or recording steps, or a better fixture. Confirm the effect after the change. Training alone may not solve inadequate resolution, incorrect installation or instrument bias. Investigate unusual readings with an audit trail rather than deleting inconvenient values to reduce scatter.
A team that can explain repeatability, reproducibility and limitations has a sounder basis for comparing pump curves. Without that understanding, measurement differences can become a supplier-quality dispute about a product that has not actually changed. The useful outcome is a process capable of supporting its intended decision, with remaining limits made visible.
Questions about measurement studies
Does a calibration certificate remove the need?
No. Instrument calibration and variation in the complete operating process provide different evidence.
Does a poor result prove an operator is careless?
No. Method, fixture, sample changes and environment can contribute and need separate investigation.
Can a software percentage release a shipment?
Not alone. Check study validity, tolerance, risk and the agreed acceptance rule before using the result.