Consider a pump test in which the motor starts, the torque trace rises, and the flow trace appears to respond half a second earlier. The spreadsheet reports that hydraulic output briefly exceeds electrical input. Before interpreting the pump, align the instruments’ clocks and response times and decide what the calculation is supposed to measure. Subtracting or dividing values from different instants can generate a result that looks precise and has no physical meaning.
There are two different kinds of timing error
The first is timestamp mismatch. A power analyzer may record on its own clock while the torque system and flow meter report through another logger. Matching the first line of each file does not align those clocks. A common hardware trigger, or an observable test event recorded by every relevant system, can establish a shared time origin. Over a long record, compare another common event near the end so clock drift does not go unnoticed.
The second is instrument response. A display can average a moving window while a torque channel updates much faster. Both timestamps may be accurate, but one reported value represents a period ending before or after the other. Find out whether the meter reports the beginning, midpoint or end of its averaging window. Record both that convention and any filter settings. Do not shift a trace until a curve looks plausible; determine channel delay from its documented response or from a separate, controlled validation.
Put the same physical event in the same row
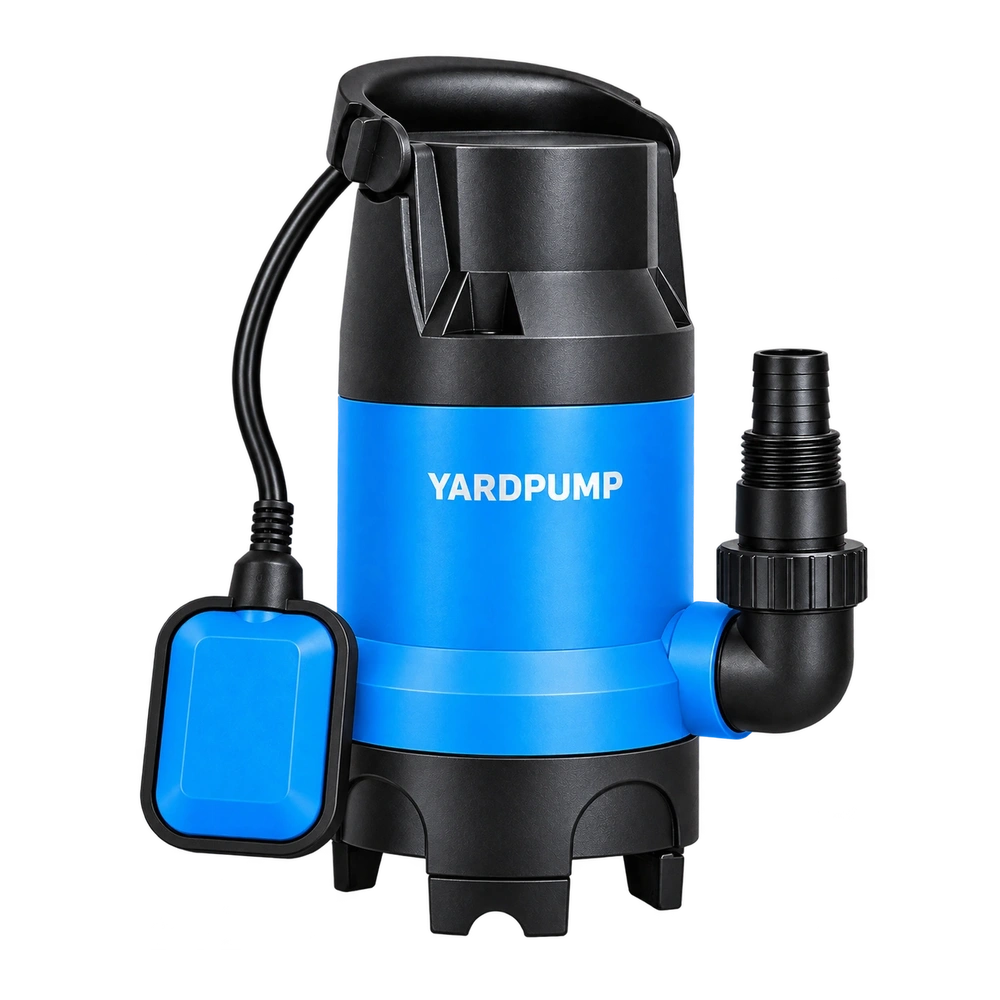
For illustration, imagine a transient with steady shaft speed after the first instant and shaft power rising from 200 to 320 watts. A hydraulic channel has reached 160 watts in the higher-power part of the event. Pairing 160 with 200 from an earlier time gives an apparent ratio of 80 percent; pairing 160 with 320 for the later instant gives 50 percent. Neither example value is a YARDPUMP specification. The arithmetic shows why a chart can change shape without any part changing. For actual shaft power use torque times angular speed for the same instant or a properly averaged synchronized interval; input power is a separate measured quantity.
Use a trial record with fixed sample identifiers, units, sign convention and a documented trigger. Preserve the unfiltered signals where the test setup permits and store the original instrument files. Check the time base, filter window, sample interval, and whether the flow and pressure taps are physically far apart. A pressure wave and accelerating liquid can introduce genuine dynamics. Do not try to align those away just because two channels should share a clock.
Choose a result that matches the decision
A buyer comparing steady duty points should wait for stabilized flow, head, speed and electrical input. The answer is a steady result with a declared window. For startup, the more useful figures may be time to reach required flow, peak input, and energy from start through a defined delivery event. If you integrate energy, use the same start and stop boundaries and account for what the system has stored in rotating parts, pressure vessels or moving liquid. An instantaneous efficiency ratio need not represent a steady energy conversion when stored energy is changing. Avoid publishing an efficiency point from that interval without a method that accounts for the transient.
These are controlled laboratory measurements. Keep guarding and electrical isolation in place; only qualified staff should install transducers, adjust wiring, or inspect rotating equipment. In the report, give the raw time origin, the known channel delays and the analysis window. If those are missing, the discrepancy is a reason to repeat the test, not a reason to rate or disqualify the pump.
Frequently asked questions
Can I align everything to the operator pressing Start?
Only if all systems record that event in a known way. A hand note alone cannot establish subsecond timing.
Does using the same sample rate solve the problem?
No. Sample rate does not fix offset, drift, averaging delay or different sensor dynamics.
Should I smooth all traces with the same filter?
Not automatically. Apply a documented method suited to the measurement bandwidth. Keep the original data so peaks and time delays remain auditable.