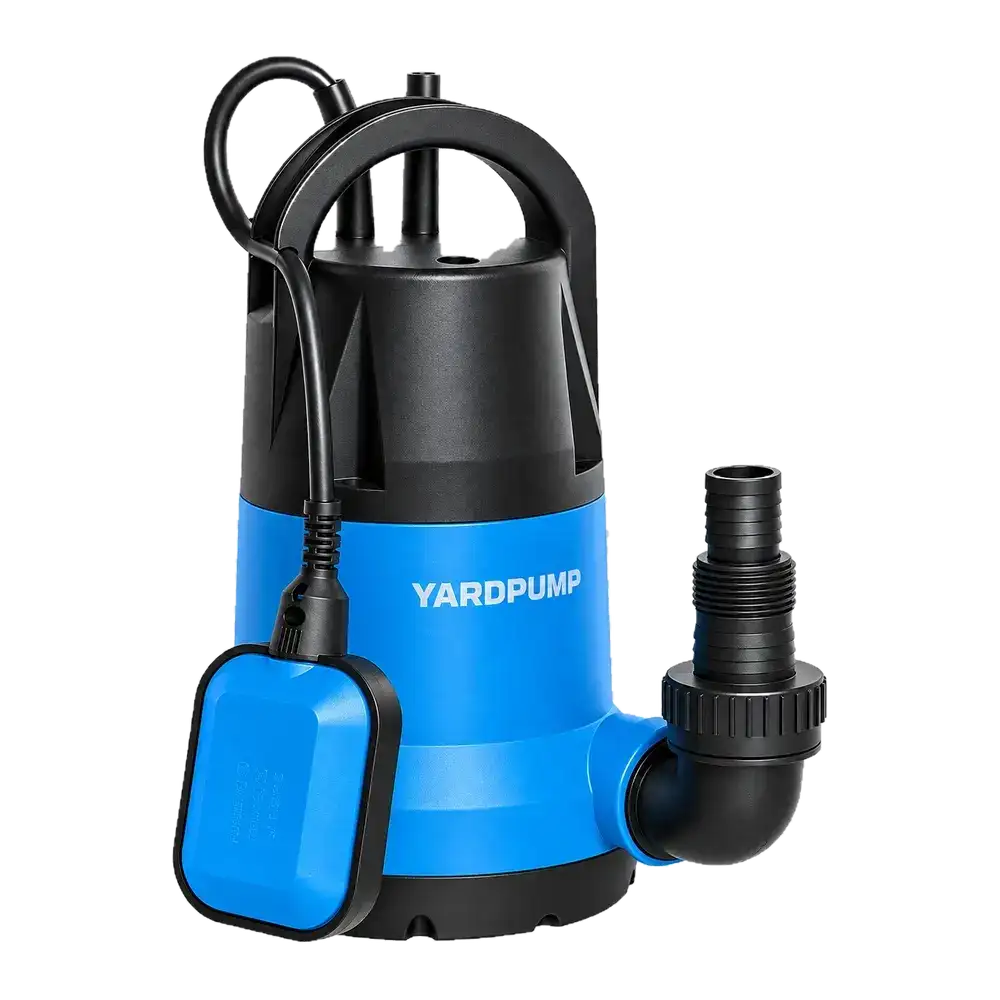
Two instruments show nearly the same current on a running single-phase pump, but one displays appreciably fewer watts. It is too early to conclude that the pump changed. Real power is the time average of voltage multiplied by current. The instrument must measure amplitude and timing accurately on the actual waveform. A modest timing error can matter when current and voltage are far out of phase.
Check what each screen actually reports
For steady sinusoidal voltage and current, real input power equals RMS voltage times RMS current times the cosine of their phase angle. RMS voltage times RMS current alone is apparent power, measured in volt-amperes. For waveforms distorted by a controller, true power factor is real power divided by apparent power; the cosine of the fundamental phase angle is not sufficient. A true RMS current label by itself does not establish that a meter can measure real power accurately on that waveform.
First compare whether both screens display watts, and whether one meter has an energy-average or a peak function active. Check the wiring and current sensor orientation according to the instruments’ instructions. The two readings must represent the same part of the circuit. A meter on the supply side of an external controller includes losses that a measurement at the motor terminals excludes. Match the supply voltage, hydraulic operating condition, warm-up state and averaging window. A startup burst and a stable running average answer different questions.
Estimate whether phase accuracy could explain the gap
Illustrative calculation for clean sine waves: 230 V times 2 A is 460 VA. At a power factor of 0.50, that is 230 W and the phase angle is 60 degrees. If a measurement chain introduces a one-degree error in one direction, it uses 61 degrees and reports roughly 223 W, even before amplitude error. In the other direction it would report roughly 237 W. At a power factor near one, the same small angle error has much less effect. These numbers show sensitivity; they are not the tolerance of any particular meter or current clamp.
Read the specification for the range actually used, including phase accuracy or the maker’s power-factor conditions. A high-current clamp on a small pump can be poorly matched even if it displays two decimal places. Check transducer ratio, instrument range, bandwidth and settling behavior. For controller output use equipment specified for the waveform and observe its measurement limits. If the indicated discrepancy is within the combined uncertainty, record that the comparison cannot distinguish the claimed difference.
Establish a comparable bench test
Have qualified personnel set up an approved analyzer and reference chain, with safe isolation before changing connections. Record time-stamped watts, volt-amperes, RMS volts and amps, true power factor, frequency and the hydraulic readings. Use concurrent measurements if the rig permits, or check operating stability when comparing sequentially. If meters agree at one steady duty but disagree only during startup, agree the time window and transient capture method instead of averaging different events. Check a known suitable bench load if instrument performance is in doubt; a resistive check may catch gross errors, but does not prove phase accuracy on an inductive load.
Resolve the measurement chain before using the numbers for a warranty decision or claiming an efficiency change. Measured electrical input alone is not shaft output or hydraulic efficiency. Tie any comparison to the same flow and head, and specify which power is being compared.
Frequently asked questions
Can I multiply the clamp reading by 230 volts to get watts?
That yields apparent power if both values are the actual RMS readings. Real power also depends on the relationship between the waveforms.
Does a calibration label cover every clamp and current range?
Check the calibration scope, the actual sensor and the relevant range and phase conditions.
Why do the readings agree after warm-up?
The start transient may have ended and the two averaging windows may now represent similar conditions. Confirm with synchronized readings.